Our methodology
Estimating the risk of collision between a racing vessel and a cetacean, on a given route and under given weather conditions. Our method brings together three things: where the animals are, where the vessels go, and how likely the two are to meet.
STEP 1 Species distribution models
Estimate cetacean densities in areas crossed by races.
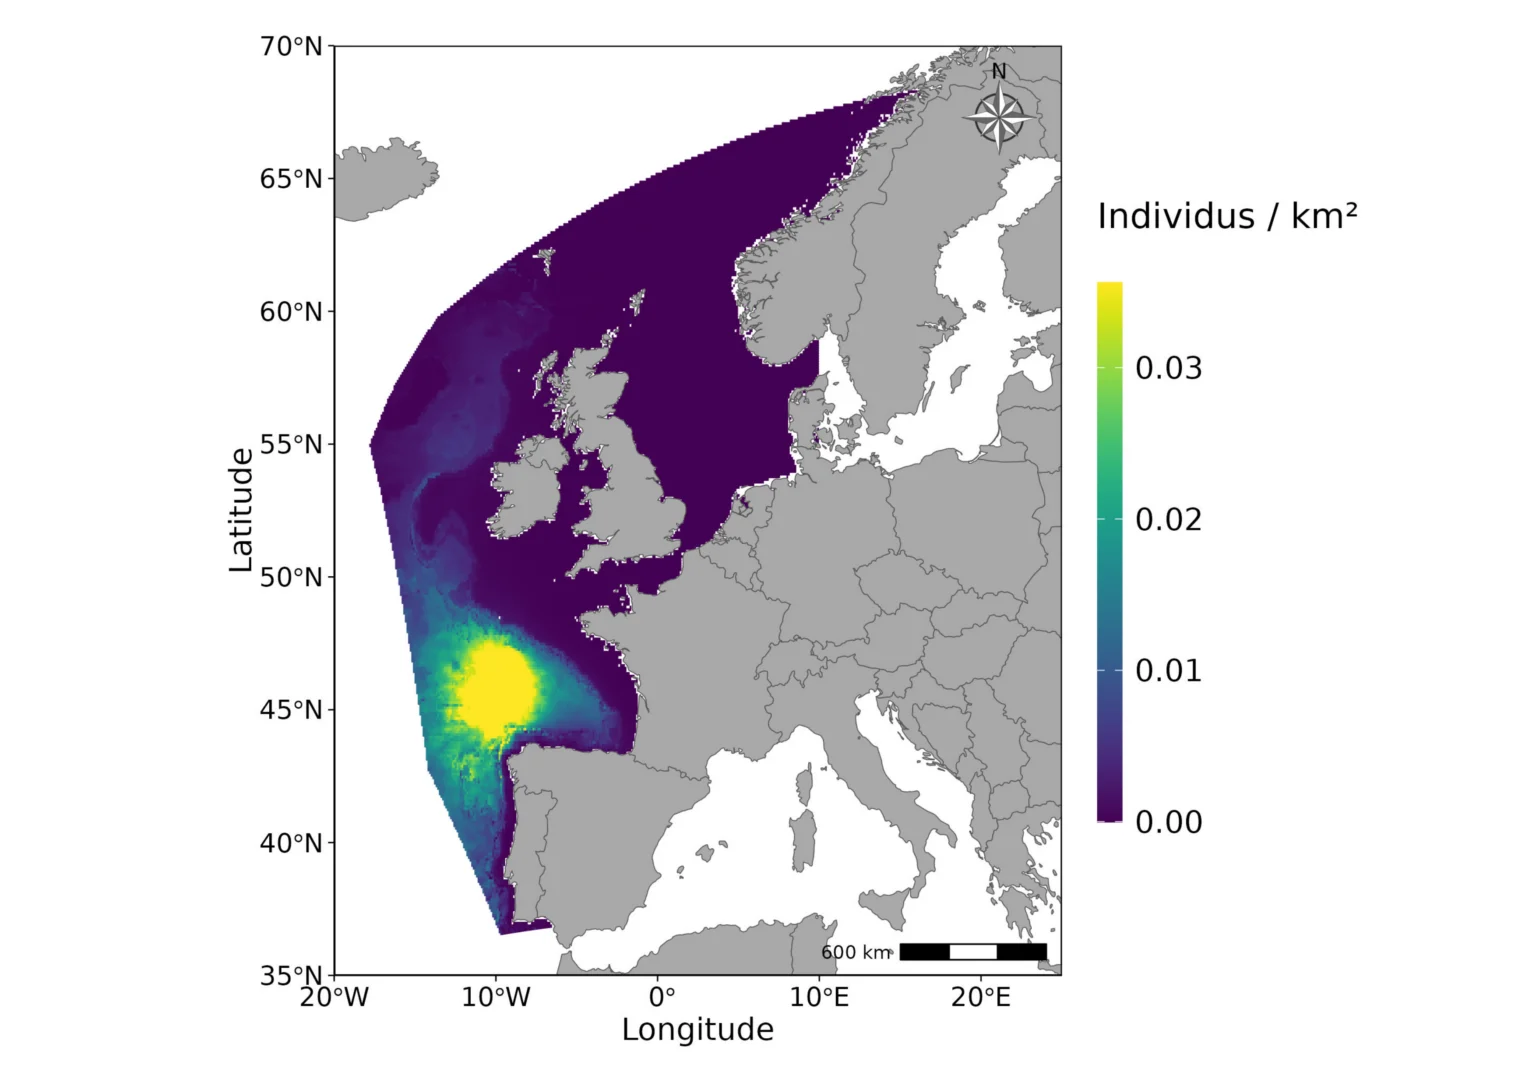
The distribution models in detail. These maps rely on the method described in: Virgili, A., Araújo, H., Astarloa Diaz, A., Dorémus, G., García-Barón, I., Eira, C., … & Ridoux, V. (2024). Seasonal distribution of cetaceans in the European Atlantic and Mediterranean waters. Frontiers in Marine Science, 11, 1319791. https://doi.org/10.3389/fmars.2024.1319791
STEP 2 Weather routing
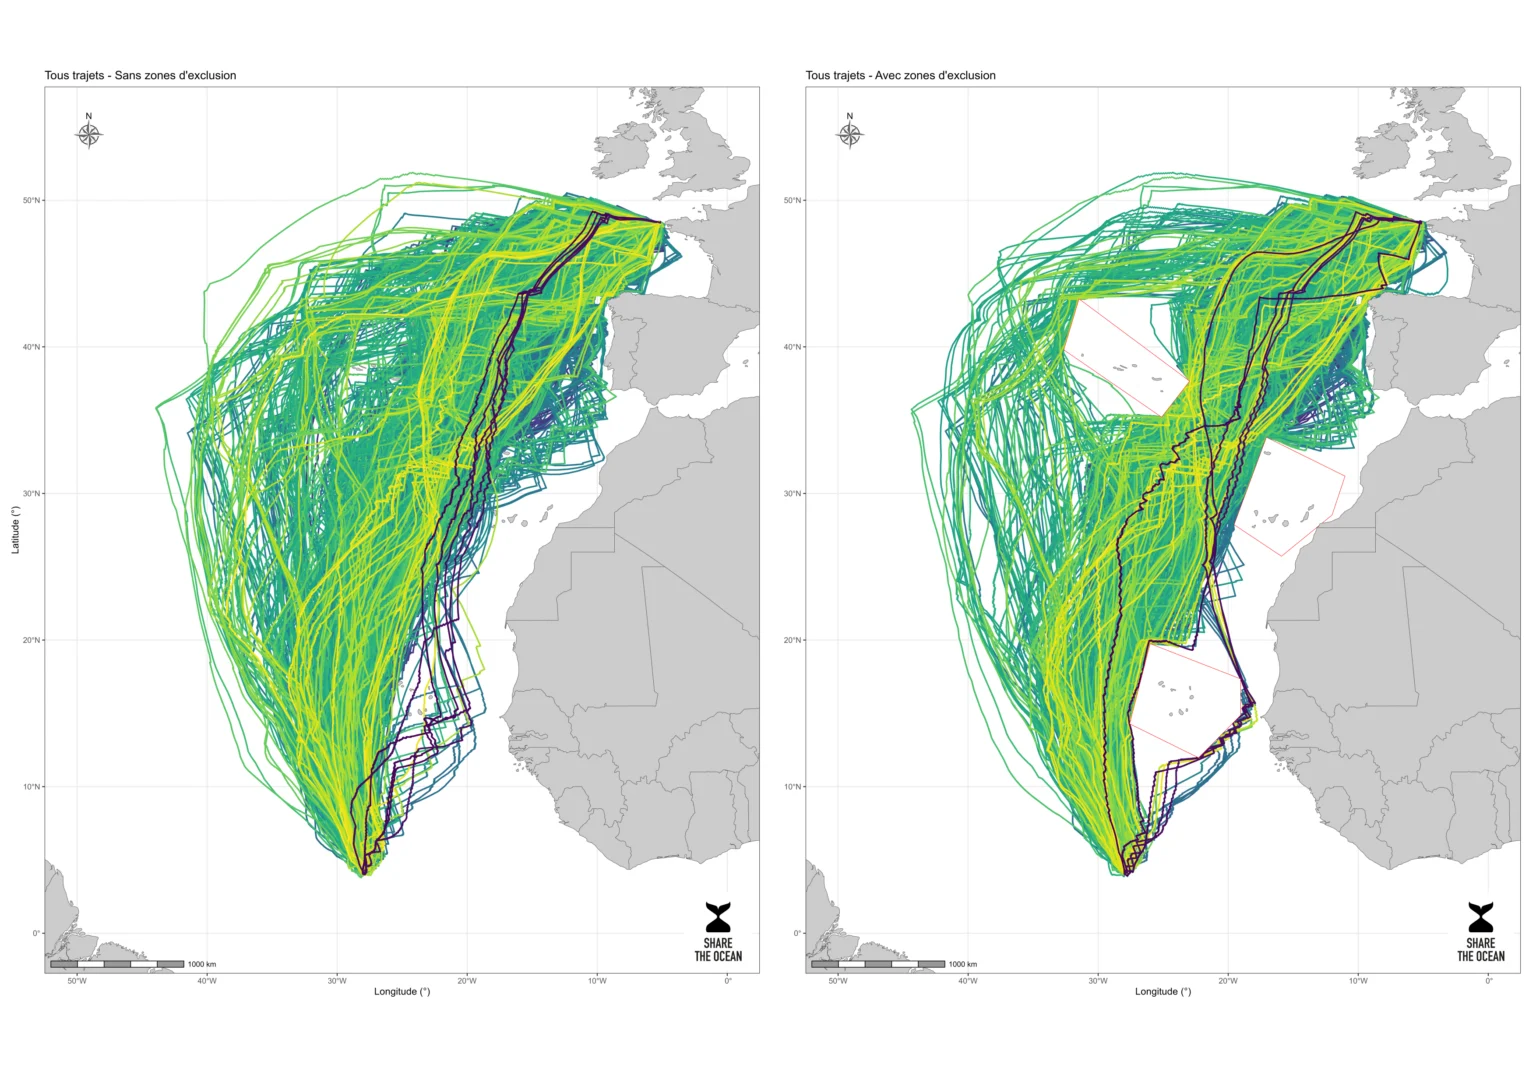
- Predict the routes taken by vessels, considering weather conditions and vessel characteristics.
- Several scenarios are tested: with and without exclusion zones, with and without imposed waypoints.
- Comparison of speeds and travel times between scenarios.
STEP 3 Encounter model
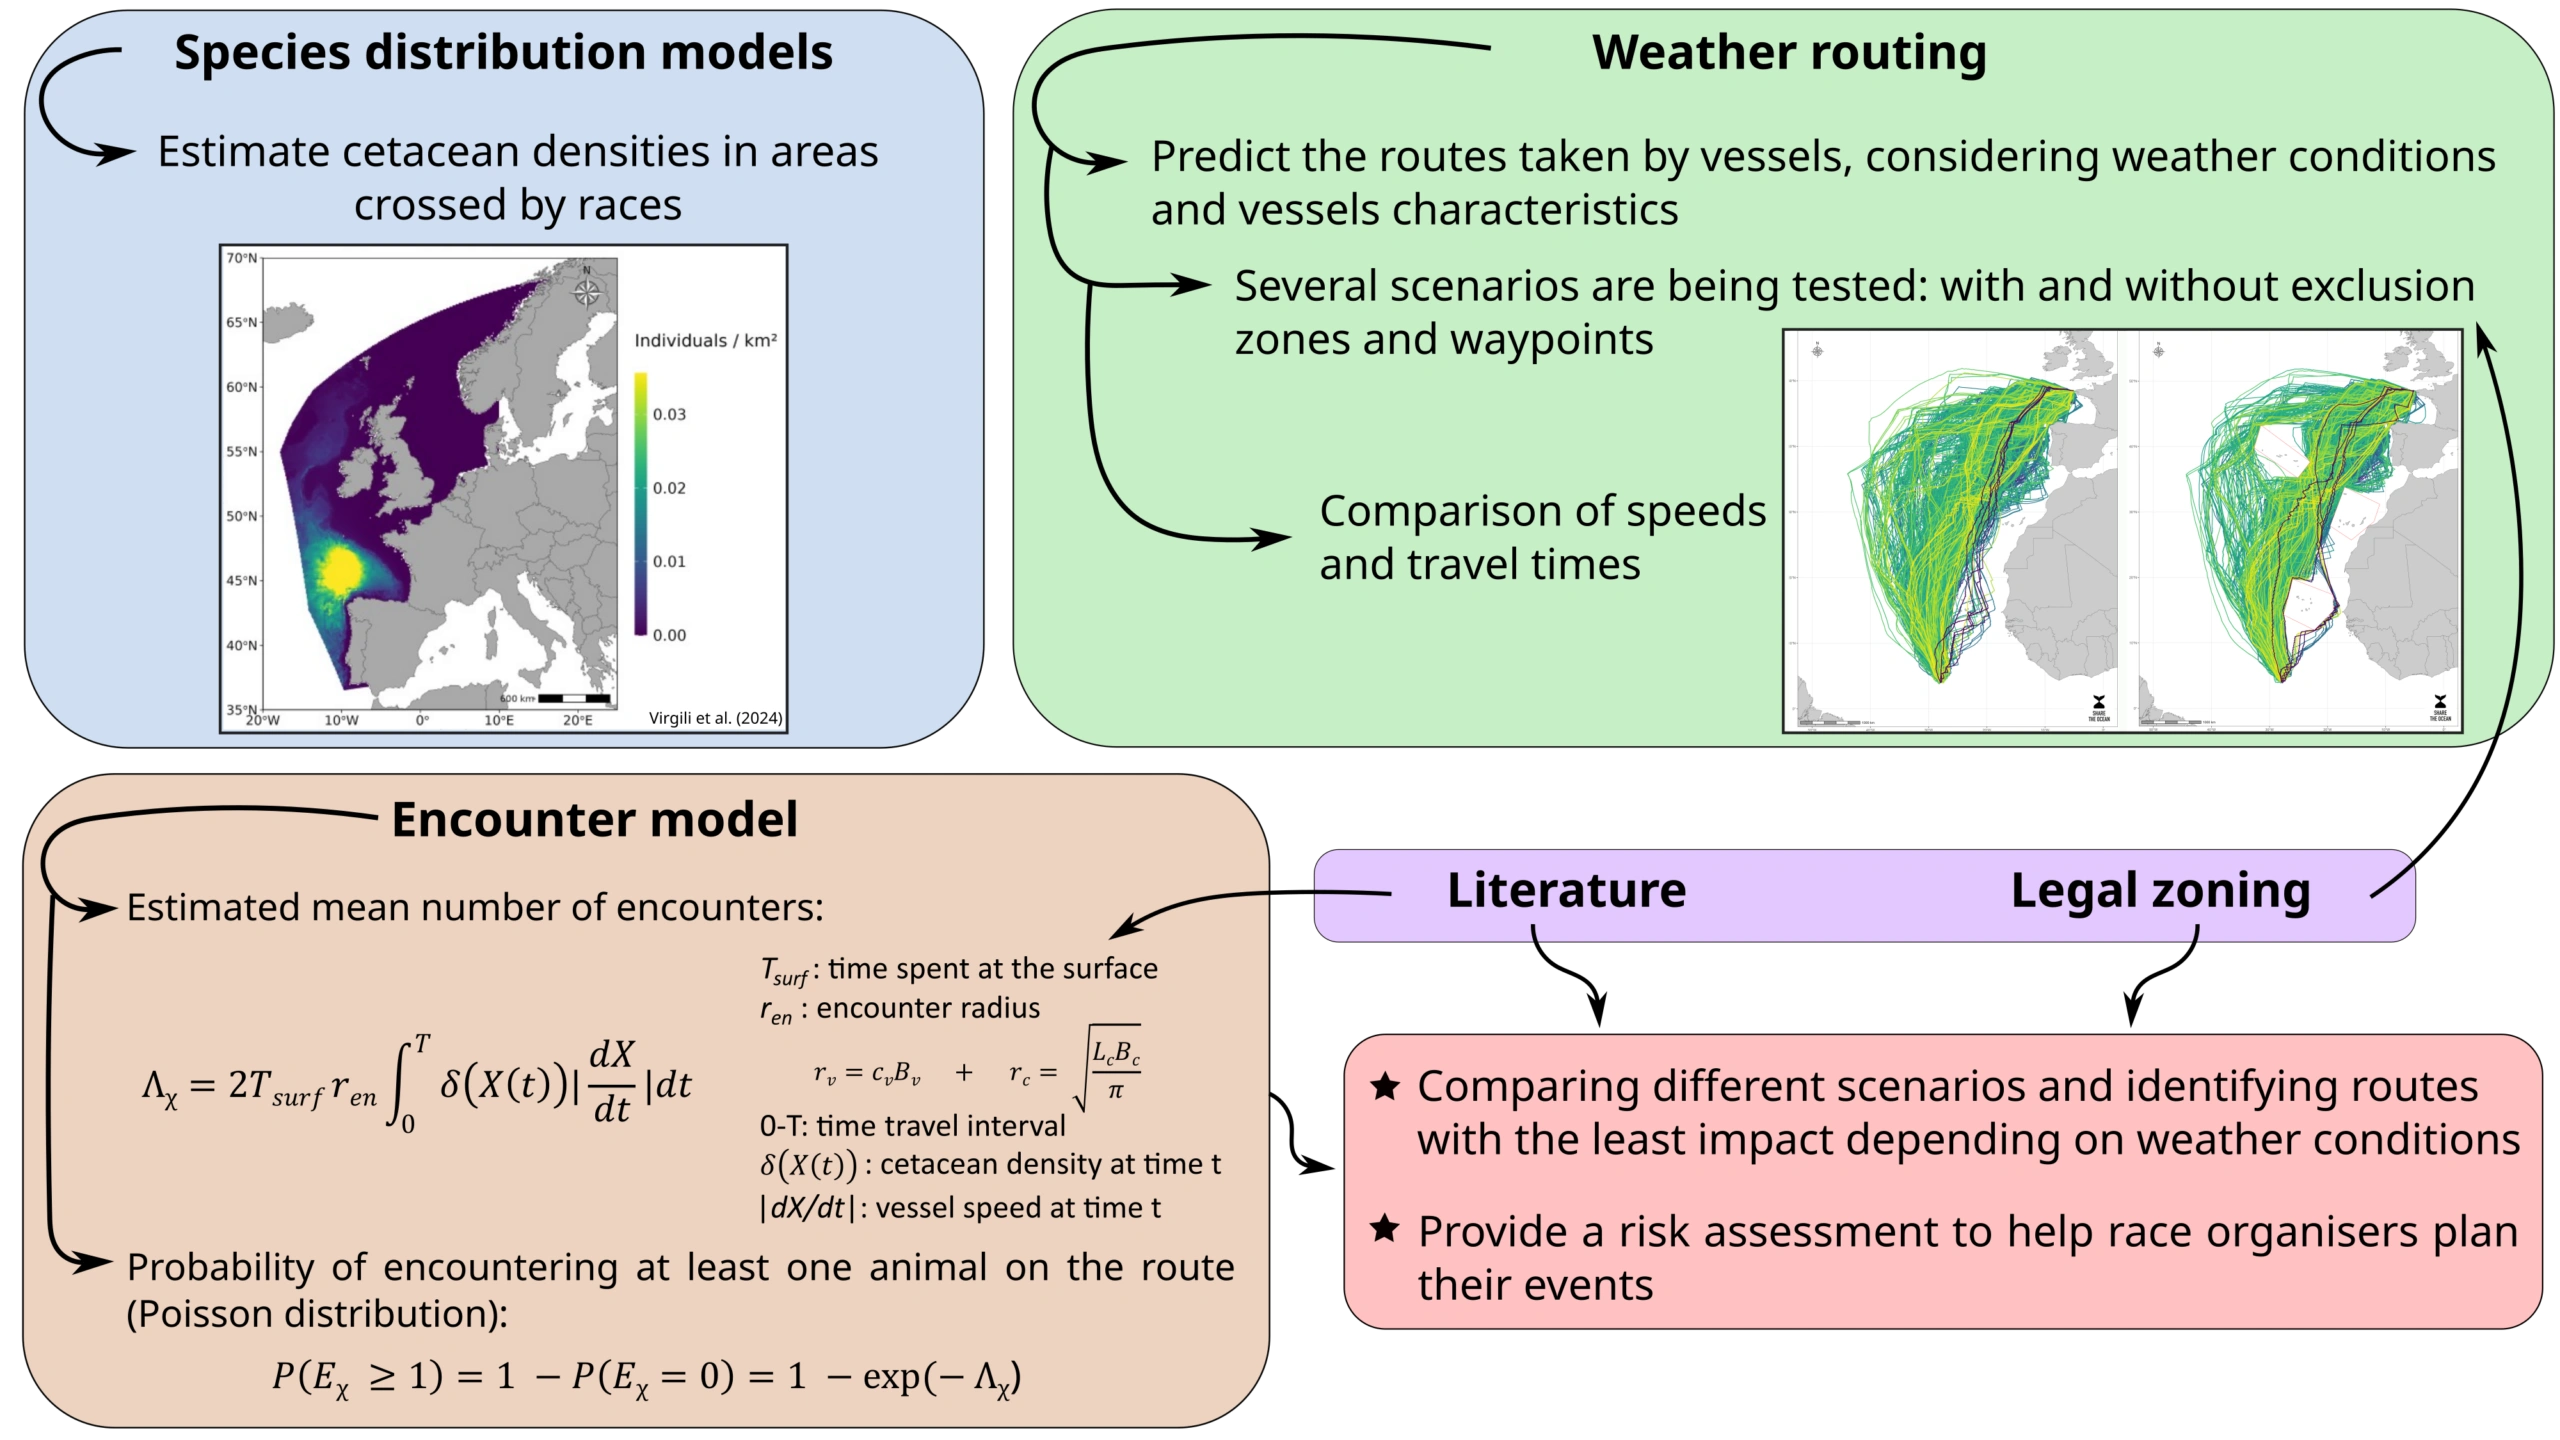
Estimated mean number of encounters
The encounter radius combines a vessel-side radius and a cetacean-side radius
- Tsurf — time spent at the surface by the animal
- 0 – T — time travel interval
- δ(X(t)) — cetacean density at the vessel position, at time t
- |dX/dt| — vessel speed at time t
- cv — coefficient related to the vessel appendages
- Bv — vessel breadth
- Lc and Bc — cetacean length and breadth
Probability of encountering at least one animal on the route (Poisson distribution)
What feeds the model
Literature — species information, demography, migratory patterns; areas of concentration where the encounter model cannot be applied for lack of density data; identification of at-risk areas; animal activity in those areas.
Legal zoning — law of the sea and marine environmental law, international, European and national law; legislation applicable to modelling (satellite vessel tracking, post-accident investigations, recording of infringements); legislation applicable to vessels (naval design, sailing race rules, use of avoidance devices).
Outcomes
- Comparison of scenarios and identification of the routes with the least impact depending on weather conditions.
- Risk assessment, to help race organisers plan their events.
Data provenance. The data used have different statuses: openly available data, data from shared sources or provided by third parties, confidential data, and data produced by Share The Ocean. Each source is used in accordance with the conditions attached to it.
Further reading. The method is described in full in: Virgili, A., Fournier, S., Le Maître, O., Pocheau, M., Ridoux, V. & Bañuls, R. (2026). Assessing cetacean encounter risk in offshore racing. Scientific Reports, 16, 3921. https://doi.org/10.1038/s41598-025-33896-6